
Most website owners install Google Analytics, glance at traffic numbers occasionally, and leave the rest of the platform unexplored. That’s understandable — the terminology is specific (sessions, engagement rate, dimensions, metrics), and it’s not immediately obvious what to look at first. But knowing how to use Google Analytics properly transforms it from a vanity dashboard into a practical decision-making tool. We go deeper on the whole subject in our Complete Guide to Software and Apps.
This guide covers Google Analytics 4 (GA4) — the current standard — with the specific reports, settings, and analysis techniques that produce actionable insight rather than just numbers.
Core concepts and key metrics
GA4’s language before the reports make sense:
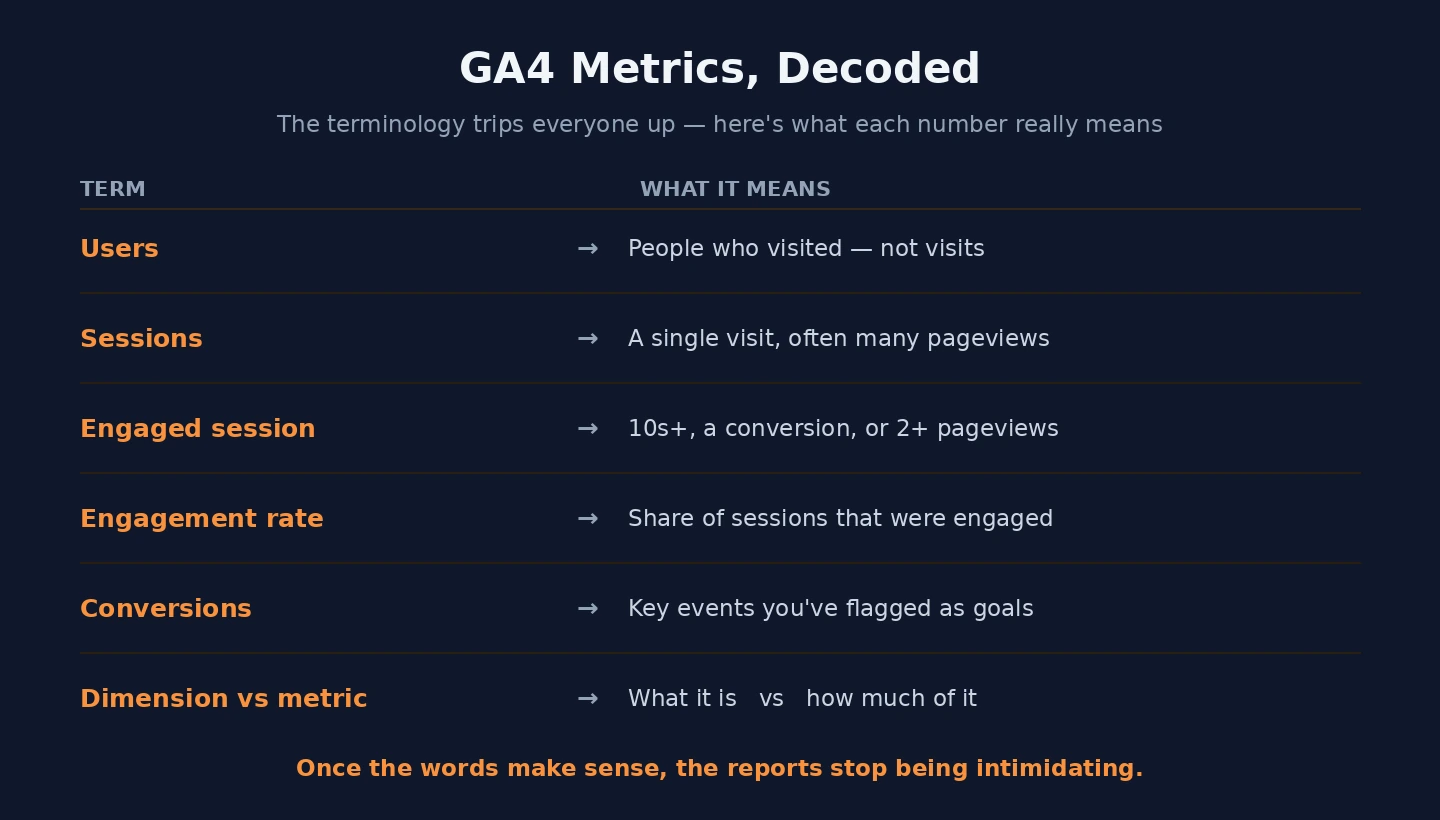
- Session: one continuous visit — a person opening the site, clicking around, leaving. One user can generate multiple sessions.
- User: a unique visitor, identified by a browser cookie or user ID.
- Event: any interaction — a page view, a scroll, a click, a form submission. In GA4, everything is an event, including page views and conversions.
- Engagement rate: the percentage of sessions where users were “engaged” — defined as lasting at least 10 seconds, including a conversion event, or viewing at least two pages. This replaced “bounce rate” as the primary visit quality metric in GA4.
- Conversion: a specific high-value event marked as important — a purchase, a form submission, a sign-up. Configuring conversions correctly is what transforms Google Analytics from a traffic counter into a marketing measurement tool.
- Dimensions: attributes describing the data — country, device category, traffic source, page path. Metrics: the numbers — sessions, users, conversion rate, revenue. Every report combines dimensions and metrics.
Essential reports and where to find them
| Report | Location in GA4 | Key question answered |
| Traffic acquisition | Reports → Acquisition → Traffic acquisition | Which channels are driving the most sessions and conversions? |
| Landing pages | Reports → Engagement → Landing page | Which entry points are converting visitors and which are losing them? |
| Pages and screens | Reports → Engagement → Pages and screens | Which content is most consumed and which is underperforming? |
| Conversions | Reports → Engagement → Conversions | How many conversions is each event generating? |
| User demographics | Reports → User → User attributes → Overview | Who is actually visiting the website (age, location, interests)? |
| Tech details | Reports → Tech → Tech overview | Are mobile users having a worse experience than desktop users? |
The traffic acquisition report is typically the starting point. It shows sessions and conversions broken down by channel: organic search (SEO), direct (typed URL), social (social platforms), referral (links from other sites), email (email campaigns), and paid search (Google Ads). The critical analysis is comparing channels by both volume (total sessions) and quality (engagement rate and conversion rate). A channel with high sessions but near-zero conversion rate is a warning sign worth investigating — it may be attracting the wrong audience.
Setting up conversions and events
Without conversions configured, Google Analytics shows traffic but not whether any of it achieves what the website is trying to do.
GA4 automatically tracks: page_view, scroll (at 90% depth), external link clicks, video_start, video_complete, file_download, and session_start.
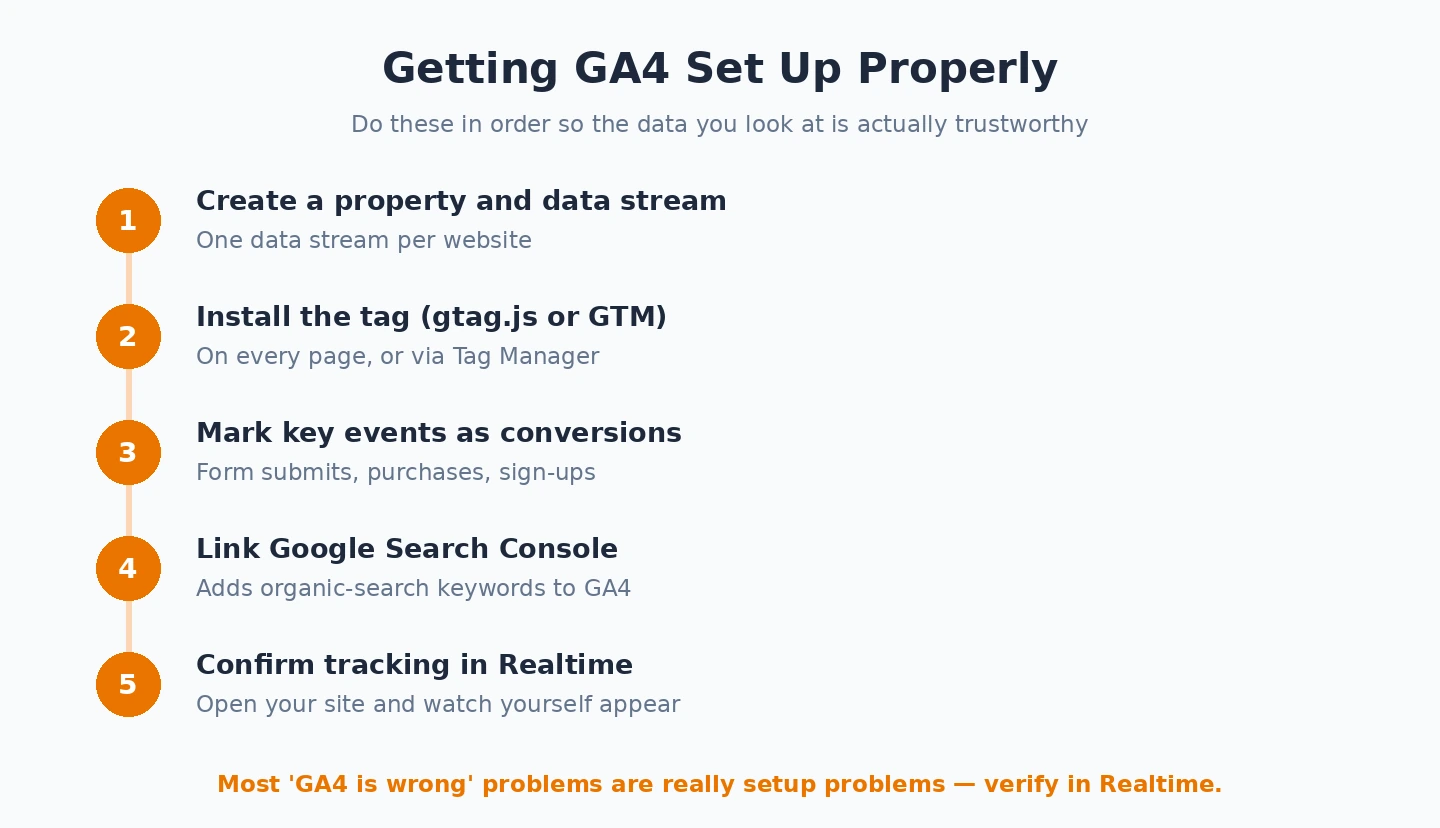
Marking an event as a conversion: Admin → Events → find the event → toggle “Mark as conversion.” The first conversion to mark is typically the event representing a lead or sale — a form submission, a purchase, a sign-up completion.
For events not automatically tracked (specific button clicks, custom form submissions, virtual page views in single-page apps): Google Tag Manager (GTM) is the standard extension. GTM installs one container snippet on the website; all tracking configurations are then managed through the GTM interface without touching the website code again. A GTM “trigger” fires on a specific user interaction, and a “tag” sends a GA4 event with that interaction’s data. Custom events appear in GA4’s Events report within 24–48 hours; mark them as conversions in the Admin panel.
Once conversions are configured, every acquisition report automatically includes a “Conversions” column showing how many conversions each channel, landing page, or traffic source generated. Conversion rate per channel (conversions ÷ sessions) is the most important single data point in a marketing analytics workflow — it tells you not just where traffic comes from, but where converting traffic comes from.
Explorations for custom analysis
Explore (left sidebar) → “+ New exploration” opens the custom analysis workspace, beyond the pre-built reports.
Exploration types:
- Free form: like a pivot table — drag dimensions and metrics into rows and columns for any custom combination
- Funnel exploration: visualises user progression through a defined sequence of steps — the most valuable exploration type for e-commerce and lead generation sites
- Path exploration: shows the actual paths users took through the site — which pages they visited before and after any given page
- Segment overlap: compares two or three audience segments visually
- Cohort exploration: tracks retention of users who first visited in specific time periods
Building a funnel exploration: define the steps of your conversion funnel (Home → Product → Add to Cart → Checkout → Purchase). GA4 shows what percentage of users reach each step and where the highest drop-off occurs. The step with the highest drop-off is the priority optimisation target. Understanding that 60% of users who add a product to cart abandon at checkout — while industry average is closer to 40% — immediately quantifies a problem and its potential revenue impact. Without funnel analysis, this abandonment shows up only as a low conversion rate with no indication of where in the path the breakdown is occurring.
Using segments to compare audiences: in any exploration, create a segment of “Users who converted” and another of “Users who did not convert” and compare them side by side — the differences in device type, traffic source, geography, and pages visited reveal what distinguishes converting visitors from non-converting ones.
Save and share explorations: the share icon in any exploration generates a link or exports to Google Sheets or PDF. Saved explorations reruns against current data each time they’re opened — build them once for recurring reports.
Audiences, comparisons, and regular reporting
Audiences group users by specific characteristics or behaviours: Admin → Audiences → “+ New audience.” Create an audience of “Users who added to cart but did not purchase” and share it with Google Ads — those users can then receive targeted reminder ads, a standard e-commerce remarketing workflow that consistently produces positive ROAS.

Comparisons add a secondary dimension alongside the primary data. In any report, click “+” next to the comparison dropdown at the top → choose a dimension value. In the Pages report, comparing “Mobile” vs “Desktop” as Device Category shows page engagement separately for mobile and desktop users — revealing which specific pages underperform on mobile and deserve UX investigation.
A practical monthly analytics review pattern:
- Traffic acquisition — total sessions and conversion rate by channel vs prior period
- Landing pages — which entry points are converting and which need attention
- Funnel exploration — is conversion rate at each step improving, stable, or declining?
- Top content — which pages are gaining or losing engagement
- Summary action items — what changed and what needs to happen next
Documenting this review in a shared document, tagging issues to specific team members, and tracking whether the previous month’s action items improved the relevant metrics creates a continuous improvement loop driven by data rather than assumptions. Our guide on using Google Sheets covers building dashboards that import GA4 data through Google’s Sheets connector for customised reporting views. For GA4’s official documentation on event tracking setup and the full list of automatically collected events, Google’s GA4 help documentation covers the complete event reference.
Connecting Google Search Console for SEO insight
Linking Google Analytics to Google Search Console (Admin → Data Streams → your stream → Link to Search Console) brings organic search keyword data directly into GA4 reports. The Search Console integration adds a “Queries” dimension to the Pages and Screens report, showing which search queries drove visits to each page — information GA4 doesn’t have without this connection (organic search traffic appears under “organic search” without keyword detail by default).
After linking, Reports → Acquisition → Search Console → Queries shows the search terms driving organic traffic, their average position, click-through rate, and clicks. This is the data that connects Google Analytics traffic numbers to SEO keyword strategy — understanding not just how much organic traffic arrives, but which queries it arrives from and which pages rank for those queries.
GA4 vs Universal Analytics — the key differences
For users familiar with the older Universal Analytics (UA), GA4 requires some mental model updating:
- Everything is an event now: page views, scrolls, conversions — all events. UA separated page views from events; GA4 unifies them.
- Engagement rate replaces bounce rate: in UA, a bounce was a session where only one page was viewed. In GA4, “engagement” requires interaction beyond 10 seconds or two page views — a more meaningful quality signal.
- Sessions are calculated differently: GA4 sessions don’t reset at midnight, and a new session is created when a user arrives from a new source mid-session — meaning direct session counts aren’t directly comparable between UA historical data and GA4.
- Goals became conversions: GA4’s conversion setup (Admin → Events → mark as conversion) replaces UA’s Goals configuration.
- Explorations replaced Custom Reports: GA4’s Explore section provides significantly more analytical depth than UA’s Custom Reports, but requires learning a different interface.
The most common frustration when learning GA4 after using Universal Analytics: the standard reports cover less by default, with more analytical depth pushed into Explorations. The trade-off is that Explorations are more powerful once learned — but the learning curve is steeper than the old Custom Reports interface. Plan for an hour or two with Explorations to understand the free form and funnel exploration types before expecting to produce useful custom reports. If this sounds familiar, How to Use Google Workspace is worth a look.
Common GA4 setup mistakes
- Not filtering out internal traffic. If you or your team visit the website regularly from known IP addresses, that traffic inflates session counts and distorts engagement rate. Admin → Data Streams → your stream → Configure tag settings → Define internal traffic → add your office/home IP ranges → create a filter to exclude them in Admin → Data Filters.
- Not linking to Google Ads. If running paid search campaigns, linking GA4 to Google Ads (Admin → Google Ads Links) enables importing GA4 conversions into Google Ads for bidding and attribution — without this link, Google Ads uses its own conversion tracking which may not align with what GA4 counts as a conversion.
- Using “Last click” attribution by default without checking. GA4’s default attribution is “data-driven” for most accounts, but check: Admin → Attribution settings. Data-driven attribution is more accurate but requires sufficient conversion volume to function; last-click is simpler but under-credits early-funnel touchpoints like organic search and display.
- Not setting up the Insights and Alerts features. Reports → Insights → create a custom insight (e.g., “alert me when weekly sessions drop more than 20% vs prior week”). Automated anomaly detection catches problems faster than weekly manual review.
Google Analytics rewards consistent use — the value of the data compounding over time as historical baselines are established, seasonal patterns become visible, and changes in performance can be traced to specific actions or external events. A site with two years of clean GA4 data is a significantly more powerful analytical asset than one with six months, because the historical context makes current numbers meaningful rather than isolated. Our guide on How to Use Google Meet covers an adjacent issue.