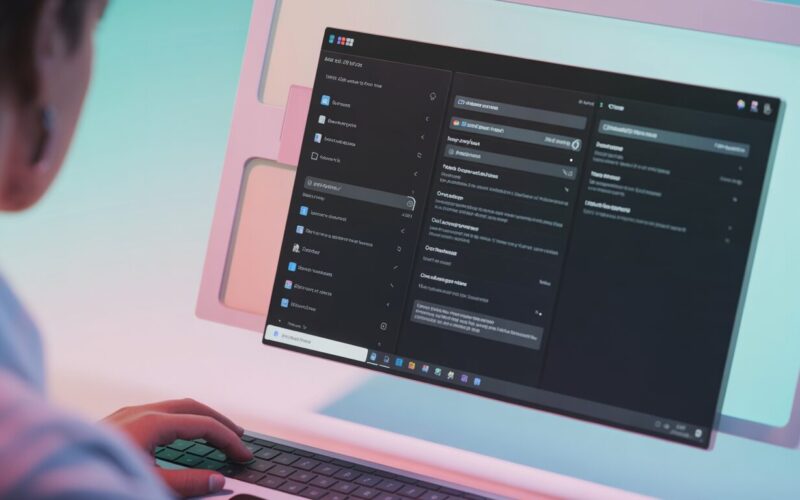
Most people open Task Manager in one of two situations: something has frozen, or the computer is crawling and they’re not sure why. They force-quit whatever is misbehaving and close Task Manager again. That’s a shame, because they’ve just glanced at one of Windows 11’s most capable diagnostic tools and used about 10% of what it can do. If you want the full context, see our Complete Guide to Windows 11.
The Windows 11 version — redesigned from the Windows 10 Task Manager — has cleaner navigation, better data, and several new views that make it genuinely useful for understanding your system rather than just killing stuck applications. This guide covers all of it, so you know what to do with each panel when you open it.
Opening Task Manager
Ctrl+Shift+Esc is the fastest method — bypasses all intermediate screens and opens it directly. Right-clicking the taskbar → Task Manager is the most common alternative. Ctrl+Alt+Delete → Task Manager works even when the desktop is partially unresponsive.
Win+X → Task Manager also works and is useful on touchscreens. On Windows 11, Ctrl+Shift+Esc is the one to make muscle memory — when something’s wrong and you need it immediately, that shortcut works the most reliably.
Processes tab — the main view
The Processes tab shows every running application and background process with real-time CPU, Memory, Disk, and Network usage. This is the default view and the one you’ll use most.
Click any column header to sort by that metric. Sorting by CPU% while the computer is slow tells you immediately which process is the bottleneck. Sorting by Memory shows the heaviest consumers. The most useful columns for diagnosis:
- CPU: percentage of total CPU capacity in use. A process consistently at 50%+ on a single-core equivalent is worth investigating.
- Memory: RAM the process is actively using. High numbers aren’t always a problem — browsers use lots of memory by design. Watch for processes using far more than their function warrants.
- Disk: how actively the process is reading/writing to storage. Sustained high disk activity causes slowdowns on HDDs especially.
- Network: data sent/received. Unexpected high network activity from an unfamiliar process is worth scrutinising.
Right-click any process → “End task” kills it. For applications: this is clean enough. For system processes: Task Manager usually prevents terminating critical ones. For anything in the “Background processes” section you don’t recognise: search the process name online before terminating — most are legitimate Windows components.
The distinction between Apps and Background processes
Windows 11 Task Manager separates running processes into “Apps” (things you opened) and “Background processes” (things running without you explicitly launching them). The background processes section is typically longer and sometimes includes surprises — update services, hardware monitoring software, cloud sync clients, and antivirus components all appear there.
A long background processes list isn’t inherently a problem. Memory usage distributed across 40 background processes adds up, but most individual background processes use modest resources. The ones to investigate: unknown process names, background processes using more than 200MB RAM, or anything you can identify as software you didn’t knowingly install.
Performance tab — live system graphs
The Performance tab shows live graphs for CPU, Memory, Disk, Network, and GPU usage. This is where you watch what’s happening over time rather than in a single snapshot.
Each resource view shows useful statistics alongside the graph:
- CPU: speed (current GHz), logical processors, utilisation percentage, base speed
- Memory: total installed, in use, available, committed, cached. The “In use” vs “Available” numbers tell you whether you’re close to RAM exhaustion. “Committed” exceeding physical RAM means Windows is using the page file (disk as virtual RAM).
- Disk: read and write speeds, active time percentage. Sustained 100% active time on an HDD is a significant performance bottleneck.
- GPU: usage across different GPU engines (3D, Copy, Video Decode, Video Encode). Chrome, video players, and games show up here when hardware acceleration is active.
At the bottom of each view: “Open Resource Monitor” — a more detailed system resource tool that goes deeper than Task Manager on resource usage patterns.
Our guide on speeding up Windows 11 covers acting on what Task Manager reveals, and our high CPU usage troubleshooting covers the specific diagnosis steps for CPU-bound slowdowns. For deep-dive resource analysis beyond Task Manager’s capabilities, Microsoft’s Sysinternals suite provides Process Explorer, Process Monitor, and other advanced diagnostic tools that extend Task Manager’s capabilities significantly.
App history tab
Shows CPU time and network usage accumulated by each application since the history was last reset. This gives a different picture from the live Processes tab — it shows which applications have consumed the most resources over days or weeks, not just right now. Useful for identifying applications that are consistently heavy even if they’re not the worst offender at any specific moment.
Startup apps tab
The Startup apps tab lists every application that starts automatically with Windows, with a “Startup impact” rating (Low, Medium, High) and the ability to disable each one.
Disabling a startup app doesn’t uninstall it — it just stops it from starting automatically at boot. You can still open the application manually. High-impact startup apps that you don’t need running at login are the fastest way to improve Windows boot time without changing any other settings. Common unnecessary startup entries: gaming launchers (Steam, Epic, EA), manufacturer utilities, cloud storage clients you rarely use, and software that adds itself to startup during installation without asking.
Users tab
On shared or multi-user Windows machines: the Users tab shows all currently logged-in accounts and which processes each one is running. If multiple user sessions are active simultaneously (common on shared home computers or RDP-accessed work machines), this tab shows resource consumption broken down by user — useful for identifying which session is driving high CPU or memory.
Details tab
The Details tab is the most technical view — it lists every process with its PID (Process ID), status, username, CPU and memory, and description. Right-clicking a process here gives more options than in the Processes tab: Set priority, Set affinity (which CPU cores the process can use), End process tree, Open file location, and Properties.
“End process tree” terminates both the selected process and all child processes it launched. This is useful for completely killing a hung application that has spawned multiple sub-processes, something “End task” on the process alone doesn’t always accomplish.
Services tab
Shows all Windows services and their current state (Running, Stopped). You can stop, start, or restart services here, and “Open Services” links to the full Services management console for more detailed configuration.
For most users: this tab is less relevant than Processes or Performance. For troubleshooting: it’s useful when a specific service is known to be causing a problem (like Windows Audio after crashes, or Windows Search if it’s indexing excessively). Right-click → Stop for the problematic service → test → Restart when ready.
Efficiency mode — Windows 11 specific
Windows 11 Task Manager includes an “Efficiency mode” option: right-click any process → “Efficiency mode.” This tells Windows to throttle the process’s CPU usage and schedule it at lower priority, reducing its impact on other applications. The process becomes a leaf in Windows’ “Eco QoS” system — it runs more slowly but uses far less CPU, which improves responsiveness for everything else.
Useful for: background applications you want running but don’t need running at full speed (update services, sync clients, media transcoders left running in the background). Not useful for: applications you’re actively using, since efficiency mode degrades their performance. Processes in efficiency mode show a green leaf icon in Task Manager.
| What you want to diagnose | Best Task Manager view |
| What’s making the PC slow right now | Processes → sort by CPU or Memory |
| Overall system health over time | Performance → CPU/Memory/Disk graphs |
| Why Windows takes long to start | Startup apps → review High impact items |
| RAM close to exhaustion | Performance → Memory → “Available” and “In use” |
| What’s using the internet in background | Processes → Network column (sort descending) |
| Which user session is consuming resources | Users tab |
| Specific process file location or properties | Details tab → right-click → Open file location |
Task Manager is most useful when you treat it as a monitoring tool rather than just a kill switch. Keeping it open in the Performance tab during a slow session, or quickly checking the startup apps tab when boot time increases — these habits turn Task Manager from a reactive tool (something broke, go fix it) into a proactive one (here’s what’s happening, here’s what I’ll do about it). The difference between the two is knowing what each view shows and when to look at it.
Task Manager limitations and alternatives
Task Manager is good for high-level overview but limited for deep investigation. Process Explorer (free, from Sysinternals/Microsoft) shows parent-child process relationships, DLL usage, network connections per process, and more. Resource Monitor (accessible from Task Manager’s Performance tab) shows more granular disk I/O, network connections, and memory detail than Task Manager provides.
For CPU performance specifically: Windows Performance Analyzer (WPA) and the Windows Performance Recorder (WPR) capture detailed ETW traces that show exactly which operations are consuming CPU cycles at a much finer granularity than Task Manager. These are developer and IT tools, but worth knowing about for stubborn performance problems that Task Manager identifies (“high CPU from this process”) without explaining (“specifically which operation in that process”).
The redesigned Windows 11 Task Manager is a genuine improvement over previous versions. The new visual style makes it faster to read at a glance, the Startup apps tab is more accessible than it was in Windows 10, and Efficiency mode adds a useful resource management option that didn’t exist before. Whether you’re a first-time user or coming from years of Windows 10: spending ten minutes exploring each tab puts you in a much better position to diagnose problems quickly when they arise.
What “Not Responding” actually means
When an application shows “Not Responding” in Task Manager: Windows has sent a message to the application’s main window that the application hasn’t responded to within a timeout period. This doesn’t mean the application is doing nothing — it may be heavily processing something (rendering, calculating, loading a large file) and simply not getting to the message queue. Or it may genuinely be hung.
Wait 30-60 seconds before “End task.” Applications doing genuine work but not responding to the Windows message queue often come back on their own. If “End task” is necessary: Windows sends a termination signal, which most applications handle by closing without saving. For applications where data loss matters (a document you were editing): wait longer, or check if the application has an auto-recovery feature that will restore your work on next launch.
Identifying malware through Task Manager
Task Manager is useful for spotting suspicious processes. Signs a process might be malicious: unfamiliar name using high CPU or memory, process name that resembles a legitimate Windows process with a slight variation (svchost1.exe vs svchost.exe, for example), process running from an unusual location (right-click → Open file location should be a system directory for Windows processes, not Downloads or Temp).
Process legitimacy check: right-click a suspicious process → Properties → General tab shows the file location and Digital Signatures tab shows who signed the executable. Legitimate Windows processes are signed by Microsoft. Third-party software is signed by the vendor. Unsigned executables from unexpected locations warrant immediate investigation.
For a more thorough malware scan than Task Manager provides: Windows Security (search in Start) → Virus & threat protection → Full scan. Task Manager helps spot symptoms; Windows Security and dedicated malware tools address the cause.
Practical use case: diagnosing a slow computer
Step by step for a computer that’s running noticeably slow:
- Ctrl+Shift+Esc → Processes tab → sort by CPU → wait 30 seconds and watch. Does one process consistently stay at the top with high CPU? That’s likely the culprit.
- If CPU looks normal: sort by Memory. Is one process using far more than expected (a browser with hundreds of tabs, a memory-leaking application)?
- If both CPU and Memory look manageable: switch to Performance tab → check Disk. Is Disk at 100% active time? On an HDD, this is a significant bottleneck. Windows Search indexing, Windows Update downloading, or a backup running are common causes.
- If all three look normal: check the GPU pane in Performance. Unexpected high GPU usage from a background application running with hardware acceleration can slow things down in less obvious ways.
- Found the culprit process: right-click → End task (for the immediate fix) or investigate why it’s high (Windows Update will eventually finish; a memory leak needs a different response).
This sequence — CPU, Memory, Disk, GPU, in that order — covers the four main hardware resources and identifies where the bottleneck is without guesswork. It’s a 2-minute investigation that gives you actionable information rather than just noticing the computer is slow. See also Windows 11 Task Scheduler for a related case.